service-pipeline-documentation
How to read the Methylseq report - advanced analysis
Zymo Bioinformatics 29 October, 2022
- Overview of the pipeline
- Report overview
- Workflow of data processing
- Sample information
- Distribution of methylation values
- DMCs
- DMRs
- Downloads
Overview of the pipeline
The report was generated with Zymo Methylseq Advanced Analysis pipeline built on the nextflow platform. A example report can be found at here.
The analysis includes the following steps:
-
Detect DMCs (differential methylated cytosines); available statistical methods include Student’s t-test, ANOVA, Fisher’s exact test, and DSS.
-
Detect DMRs (differential methylated regions); available statistical methods include DSS and dmrseq.
-
Annotate both DMCs and DMRs by finding overlapped genes, promoters, exons, introns, and CpG islands.
-
Functional enrichment analysis of DMR-overlapped genes by using the tool g:Profiler.
-
Generate an html report with tables, figures, and downloading links.
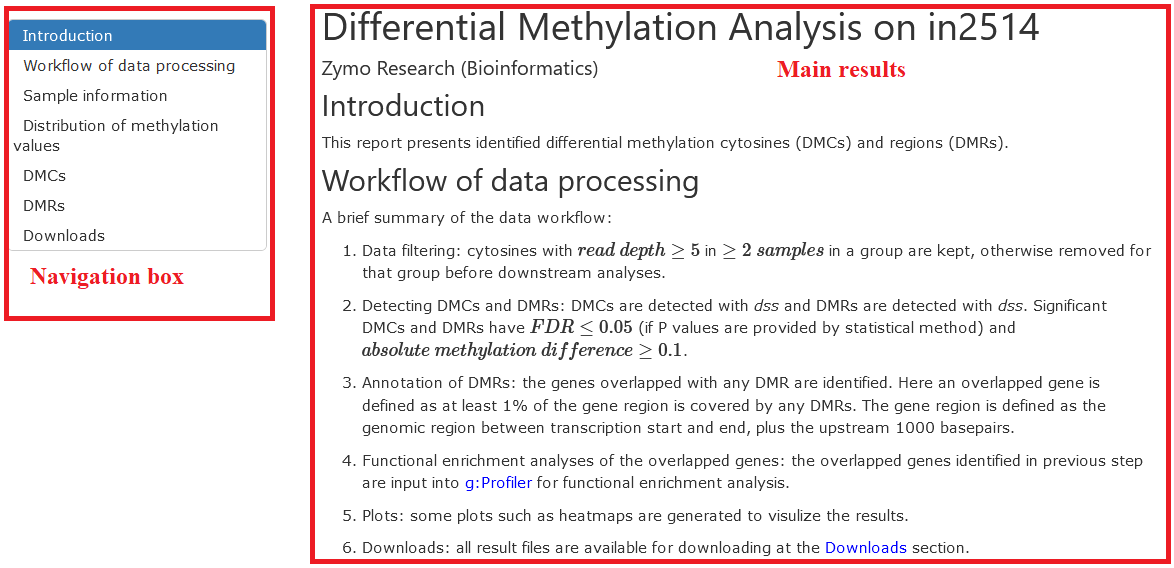
Report overview
This report is generated by diffMeth. It has a navigation box on the left and the main results on the right. And the results are divided into sections, including workflow summary, sample information, DMCs and DMRs, functional enrichment analysis, and file downloads.
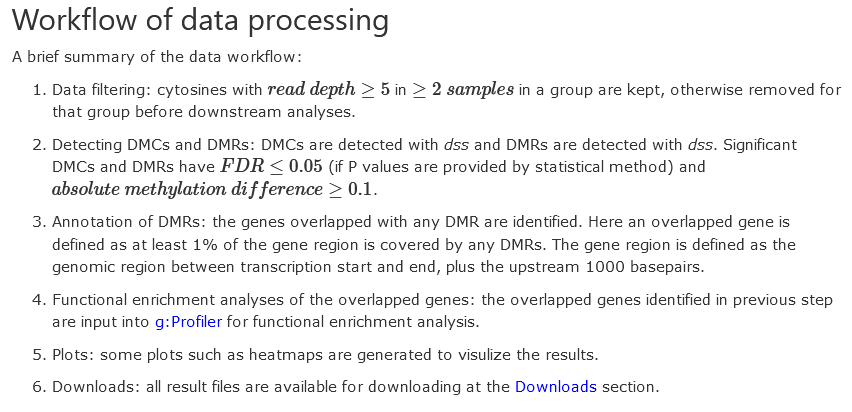
Workflow of data processing
This section provides a summary of the data analysis, including the thresholds used for filtering input data, the tools and parameters for analyses, and the results generated.
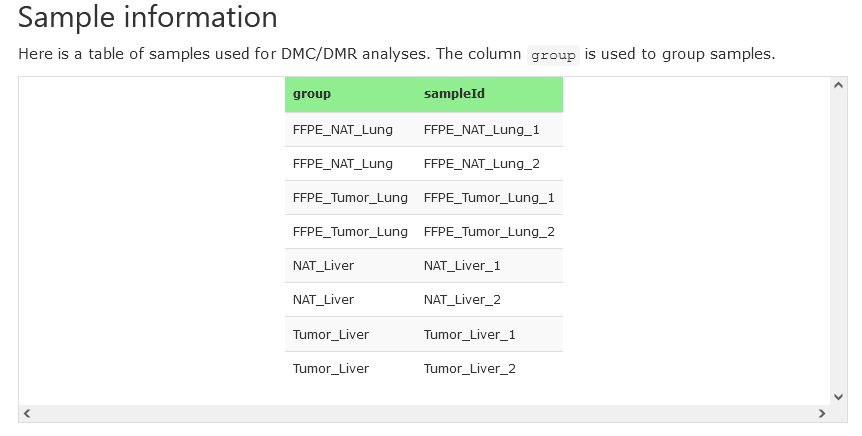
Sample information
This section provides the sample information, including sample IDs and their associated groups.
Distribution of methylation values
This section shows the distributions of methylation values for all CpGs using the filtered data. The distributions are made at the both sample and group levels.
The same color scheme is used in both per-sample and group-mean distributions.
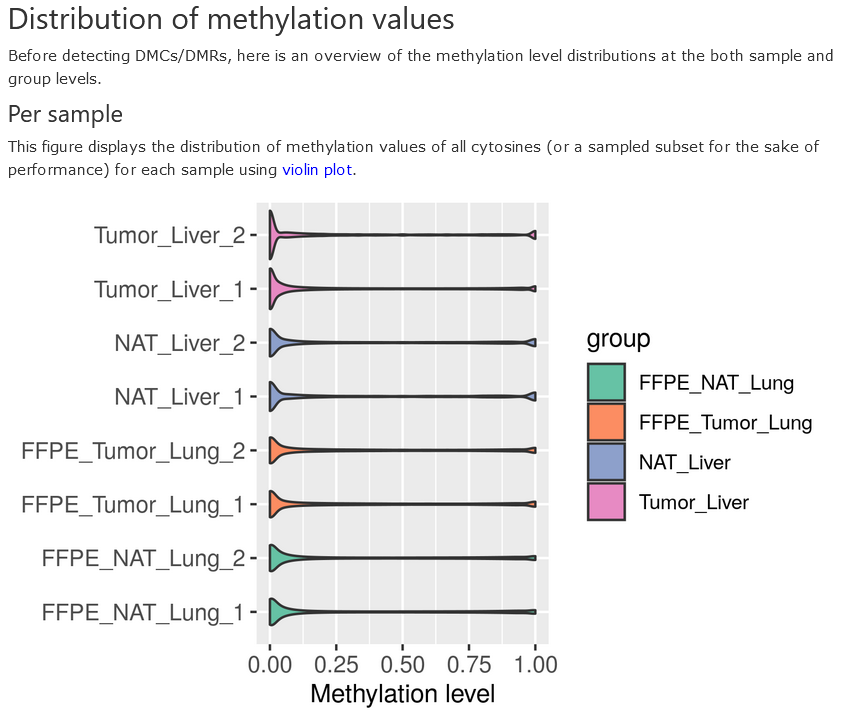
Methylation distribution - per sample
The methylation values of all CpGs (after read depth filtering) in each sample is presented in a violin plot. The samples are colored to distinguish different groups.
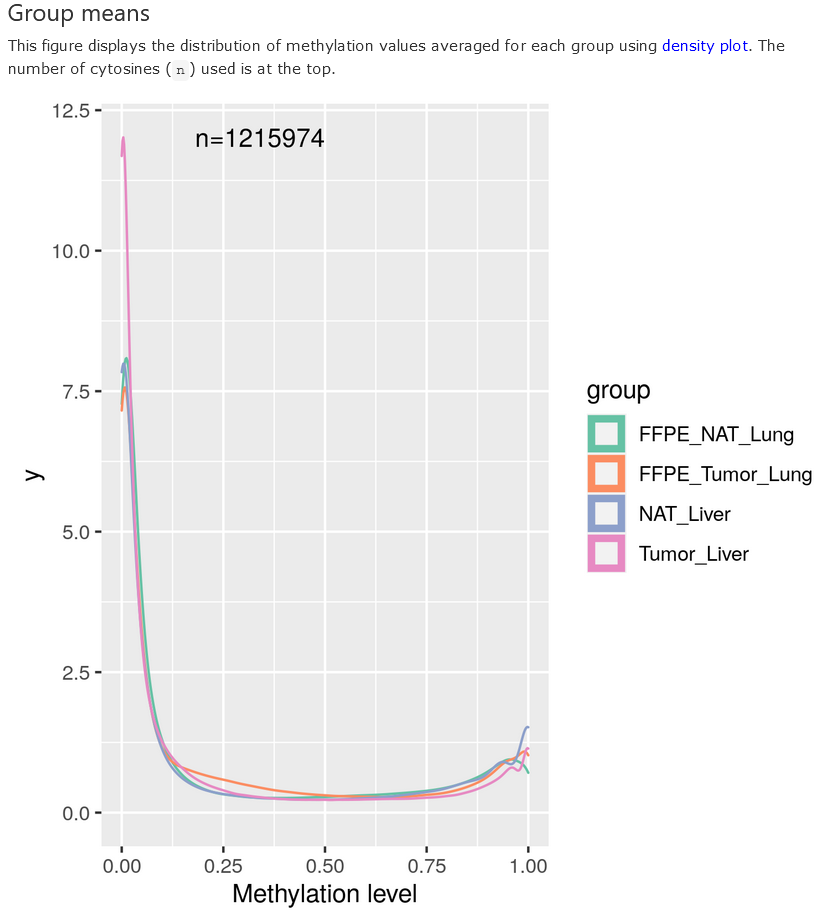
Methylation distribution - group means
The methylation values of each CpG are averaged over samples in a group to derive group means, which are displayed in a density plot. Note that only CpGs that pass the filterings in all the groups are used, and when there are more than 5 million CpGs, the sites are down-sampled to 5 million for computing efficiency.
DMCs
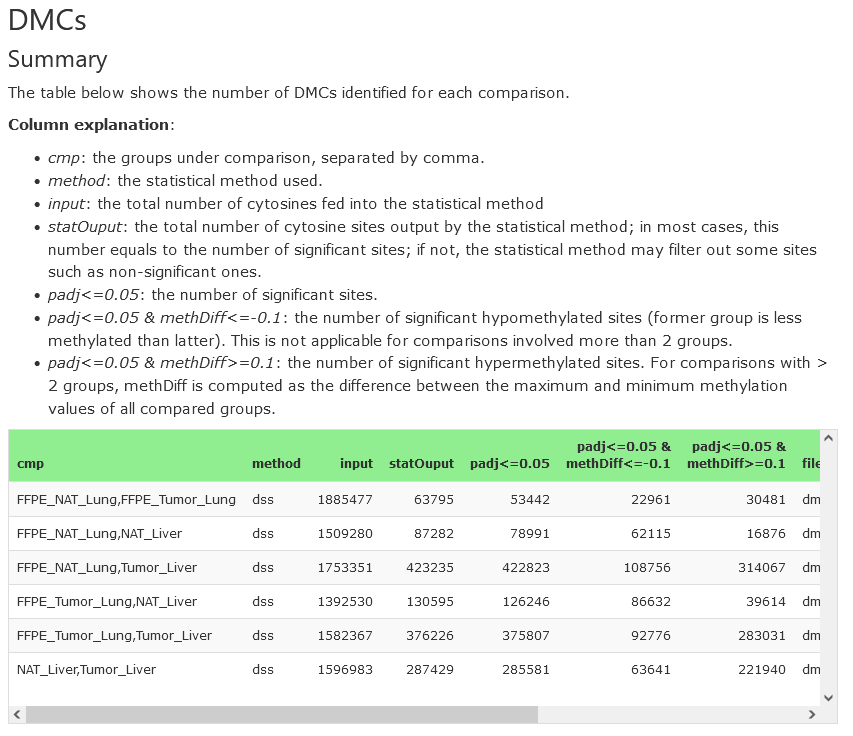
DMCs, short for differential methylated cytosines, can be detected by using various kinds of statistical methods. In this section, we present a summary of the detected DMCs and the heatmaps of top significant DMCs (reduced to 3000 if more are detected) for each group comparison.
Summary
For each comparison, the table presents the compared groups, the number of input sites (after filtering), the number of significant DMCs (both hyper- and hypo-methylated) and the result’s filename. The filenames can be used to download the data from the Downloads section.
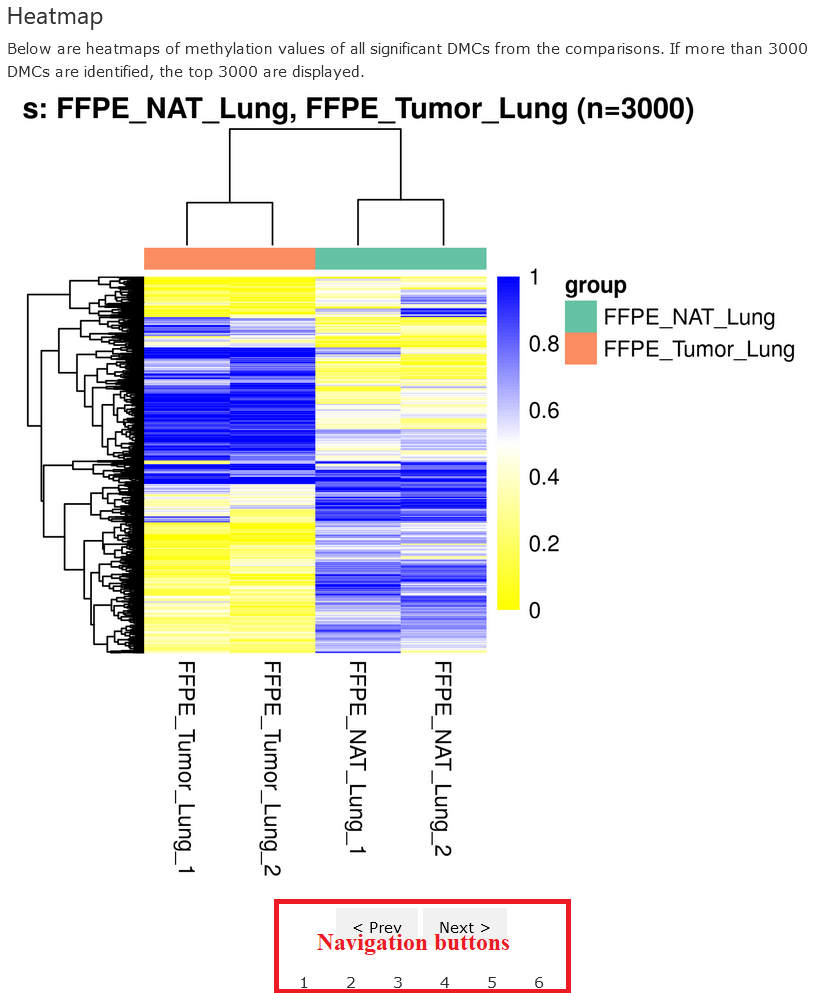
Heatmap
This section shows the heatmaps of methylation values for the DMCs detected in each comparison. The heatmaps are organized in a slideshow and one can click the buttons at the bottom to access different ones.
In each heatmap, the title at the top shows the groups under comparison and the number of DMCs used (if more than 3000 DMCs detected, then only top 3000 will be used). The dengrograms at the top and left show the clustering of samples and sites, respectively. The clusterings were computed using hierarchical clusterings with Eucleadian distances.
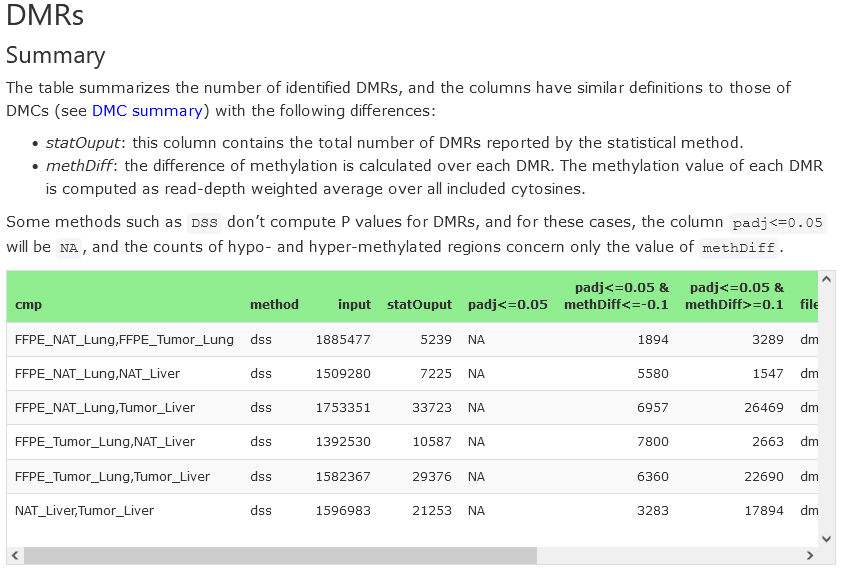
DMRs
DMRs stand for differential methylated regions. They can also be detected by using various kinds of statistical methods. This section has a similar structure as that of DMCs, so one can find a summary table as well as heatmaps for top DMRs.
Summary
For each comparison, the table presents the compared groups, the number of input sites (after filtering), the number of significant DMRs (both hyper- and hypo-methylated) and the result’s filename. The filenames can be used to download the data from the Downloads section.
Note that many DMR statistical methods, such as DSS, don’t compute P values, and thus no adjusted P values are computed.
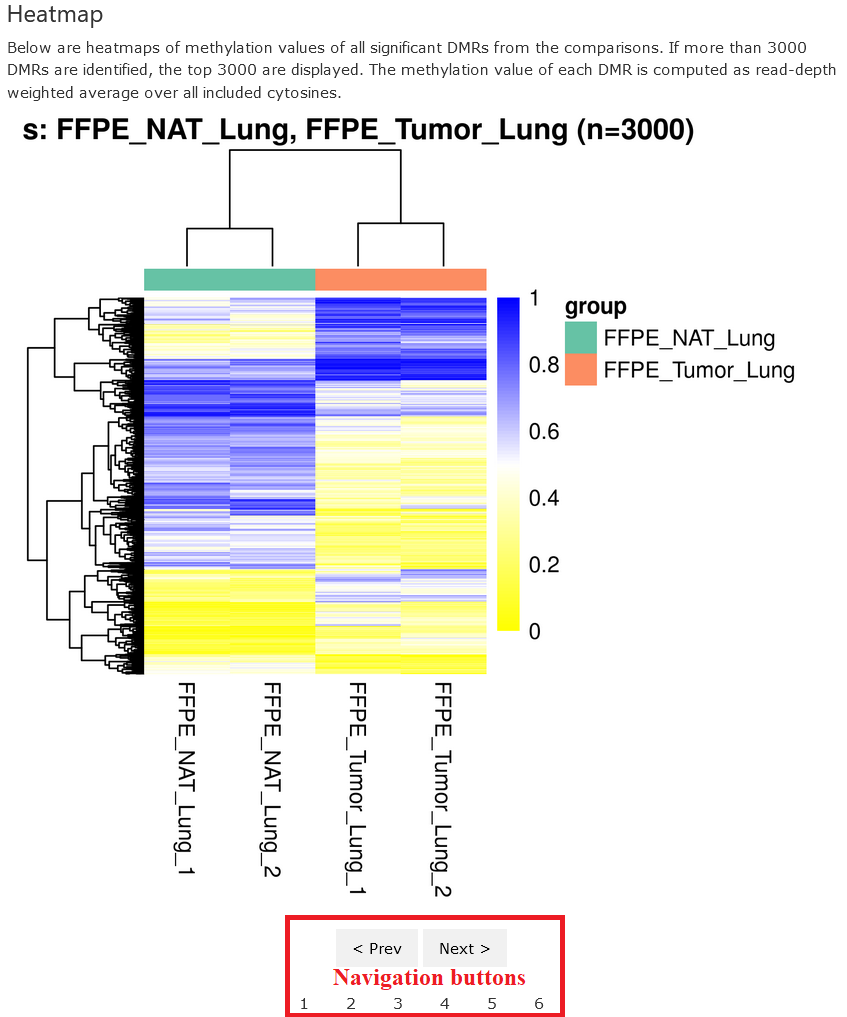
Heatmap
This section shows the heatmaps of methylation values for the DMRs detected in each comparison. Again, only top 3000 DMRs are presented. The methylation value of each DMR in each sample is computed as follows:
where
and
provide the numbers of total and methylated reads at each site,
respectively.
Similarly, the dengrograms were computed using hierarchical clusterings with Eucleadian distances.
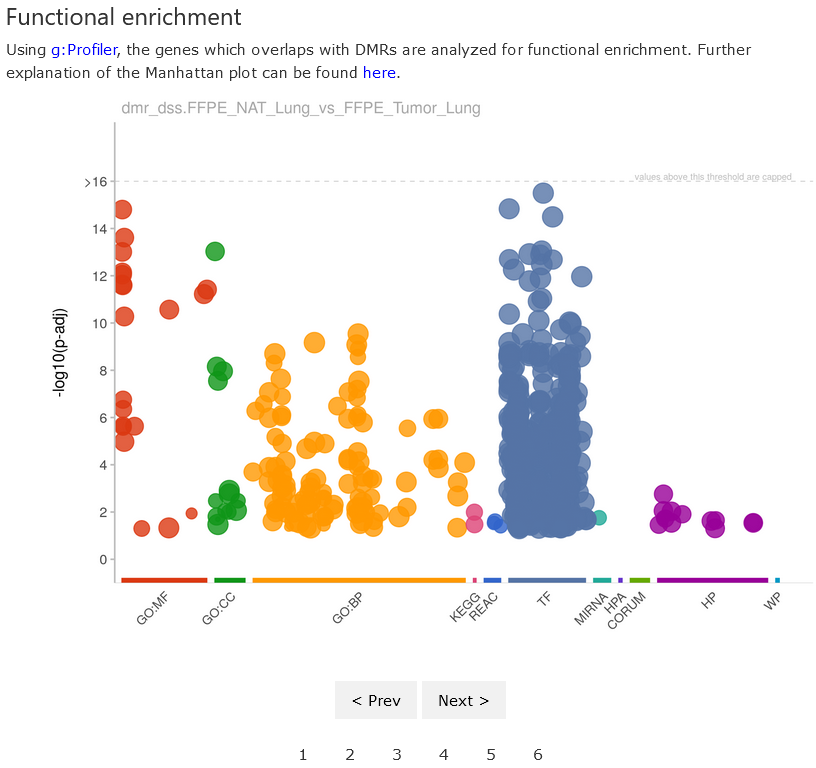
Functional enrichment
This section shows the results of functional enrichment analysis of
DMR-overlapped genes using the platform
g:Profiler. Briefly, the
platform maps the provided gene list to functional terms and finds the
enriched terms. The functional terms come from various databases
(GeneOntology, KEGG, CORUM, etc). In the plot, each dot represents one
functional term with the statistical significance shown on the y-axis
(in the format
).
Downloads
This section provides links to all kinds of downloadable results. At present, the provided are DMCs, DMRs, and functional enrichment analysis of DMR-overlapped genes.
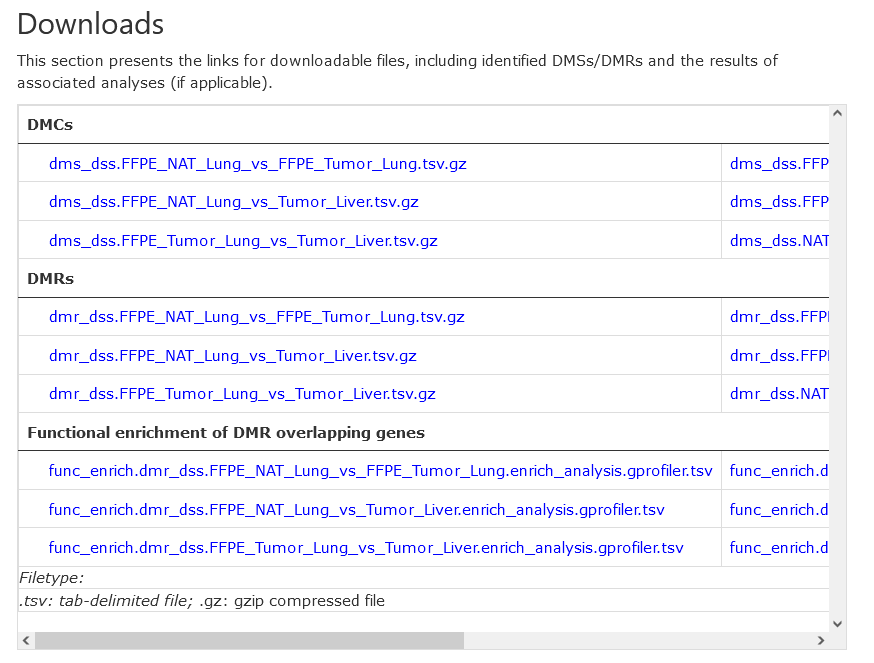
These files are normally tab- or comma- delimited, and compressed in gzip. More details on the file formats are provided below:
DMC files
The filename is named in the format of dms_<method>.<group1>_vs_<group2>.tsv.gz, where <method> provides the statistical method (e.g., DSS), and <group1> and <group2> are the compared group names.
Note that some columns are method-specific and thus omitted in output; for example, the column ‘postprob.overThreshold’ is only available in the output of DSS. The same principle applies to the DMR files.
| Column | Description |
|---|---|
| chr | Chromosome name of the DMC |
| pos | Chromosomal position of the DMC. 1-based. For a CpG, this position always refers to the C on the plus strand. |
| group1Mean | The mean of methylation values for group 1 samples. For DSS-based output, these values are smoothed. |
| group2Mean | The same as `group1Mean`, but for group 2. |
| methDiff | The difference between `group1Mean` and `group2Mean`. |
| diff.se | The standard error of `methDiff` |
| stat | The statistics computed for `methDiff`. |
| phi1 | The estimated dispersions for group 1. Available for DSS method only. |
| phi2 | The estimated dispersions for group 2. Available for DSS method only. |
| pValue | Raw P values |
| padj | Adjusted P values using the Benjamini & Hochberg method. |
| postprob.overThreshold | The posterior probability that `methDiff` is greater than prespecified delta (default 0.1). |
| \<sampleId\> | The columns headed by sample Ids show the raw methylation value of each DMC in each sample. |
DMR files
The filename is named in the format of dmr_<method>.<group1>_vs_<group2>.tsv.gz, where <method> provides the statistical method (e.g., DSS), and <group1> and <group2> are the compared group names.
The file content is explained as follows:
| Column | Description |
|---|---|
| chr | Chromosome name of the DMR |
| start | Genomic start of the DMR, 1-based |
| end | Genomic end of the DMR, 1-based and inclusive |
| length | The length of the DMR in basepairs, i.e., from start to end |
| nCG | The number of CpGs included in the DMR |
| group1Mean | The DMR’s mean methylation level over group 1 samples; for DSS output, it may be smoothed. |
| group2Mean | The same as `group1Mean`, but over group 2 samples. |
| methDiff | The methylation difference between the two groups. |
| areaStat | The sum of the test statistics of all CpG sites within the DMR |
| \<sampleId\> | The columns headed by sample Ids show the methylation value of the DMR in each sample, i.e., the mean of all CpGs within the DMR. |
Functional enrichment of DMR overlapping genes files
These files are generated by gprofiler, implemented in R package gprofiler2. The files show the significant functional terms. One can find more information on the analysis and the output format by visiting here and here. The functional terms examined are from multiple resources, including Gene Ontology, KEGG, Reactome, TRANSFAC, miRTarBase, CORUM, Human Protein Atlas, Human Phenotype Ontology, and WikiPathways.
The filename is named in the format of func_enrich.dmr_<method>.<group1>_vs_<group2>.enrich_analysis.gprofiler.tsv, where <method> provides the statistical method (e.g., DSS), and <group1> and <group2> are the compared group names. Each row shows the statistical result for each functional term.
| Column | Description |
|---|---|
| query | A label for the input query, in the format group1_vs_group2. The value is constant in each file. |
| significant | TRUE if the enrichment of input genes in the functional term (see columns term_id and term_name) is significant; otherwise FALSE. |
| p_value | Hypergeometric p-value after correction for multiple testing. More on the statistical tests at here. |
| term_size | The number of all genes that are annotated to the functional term in the annotation source (see the column source). |
| query_size | The number of input genes that are associated with at least one functional term in the annotation source (see the column source). This value is constant for each annotation source for a given analysis, e.g., all genes overlapped with the DMRs detected from a group comparison. |
| intersection_size | The number of input genes annotated to the term in each row, i.e., the overlap between the genes in input and all the genes annotated to the functional term. |
| precision | The ratio between intersected genes (both in query and annotated to the term) and the total query, i.e., intersection_size/query_size. |
| recall | The ratio between intersected genes (both in query and annotated to the term) and all the genes annotated to the functional term in the annotation source, i.e., intersection_size/term_size. |
| term_id | Unique identifier for the functional term in each row, e.g <GO:0005005>. |
| source | Abbreviated name for the annotation source, e.g., |
| term_name | The short name of the functional term. |
| effective_domain_size | The total number of all genes annotated in the source domain genomewide. E.g., all the human genes annotated in |
| source_order | The numeric order for the term within its source domain, relevant to the positions in the Manhattan plot. |
| parents | A list of term IDs (separated by ‘|’) that are direct parents of the term, and an artificial root node for non-hierarchical data. |
More on the statistical test
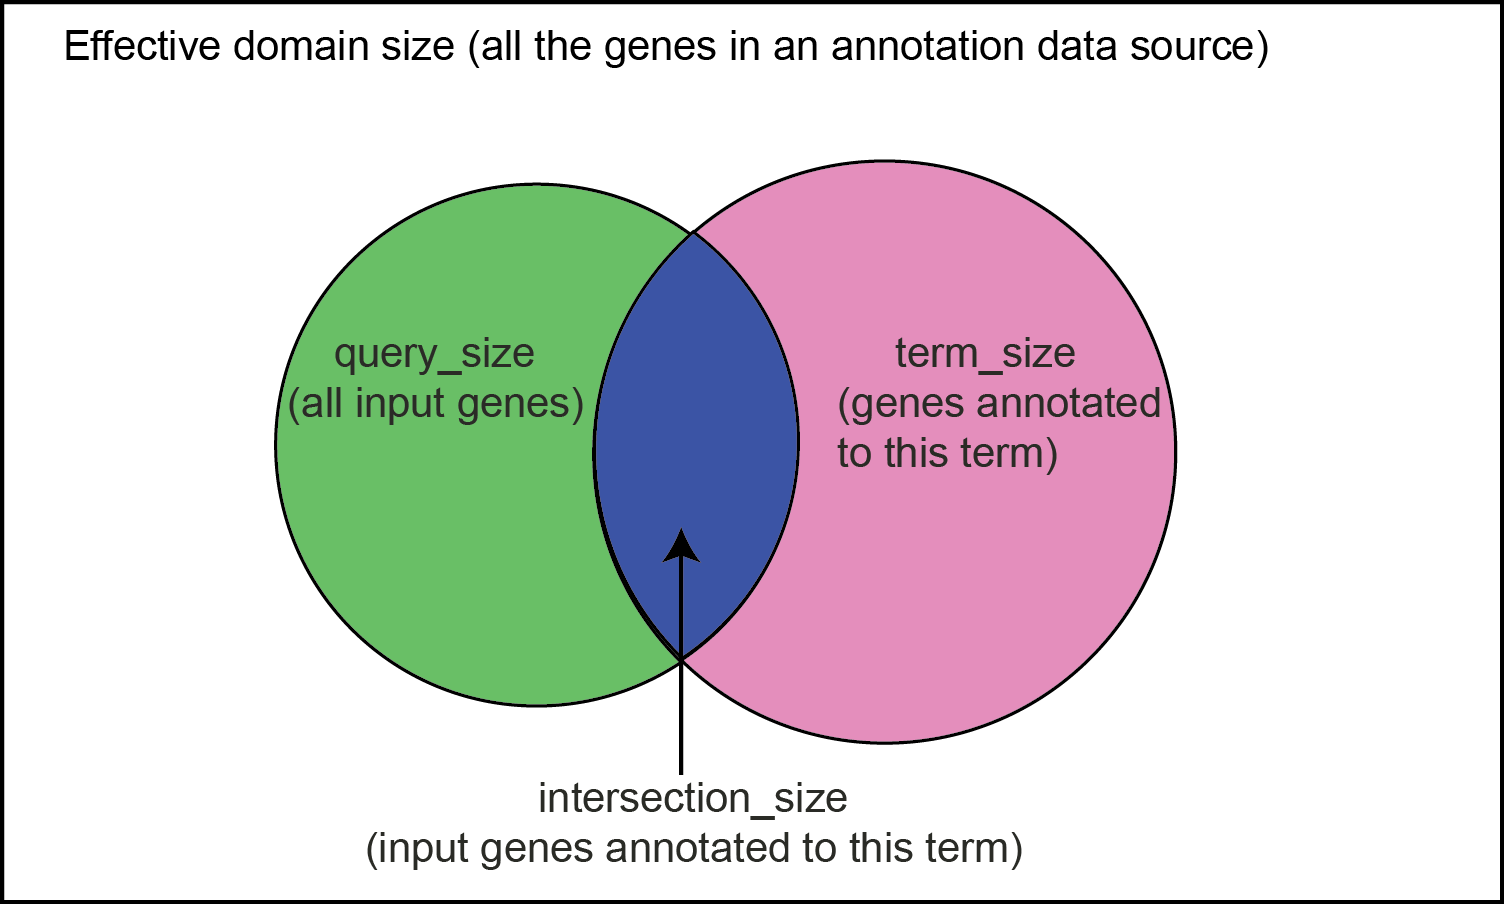
Hypergeometric test is used to test whether input genes are enriched (i.e., overrepresented) in any functional term (e.g., RNA folding, <GO:0034337> from the annotation source GeneOntology:biological_process). Essentially, it compares the fraction of input genes that are annotated to a functional term against the background fraction, which is the fraction of genes annotated to the term in the entire annotation source.
Using the figure below as an example, the rectangle denotes the entire annotation source (e.g., GeneOntology:biological_process), and the number of genes it contains is called effective_domain_size. The pink circle denotes the genes annotated to a functional term (e.g., RNA folding, <GO:0034337>) in the annotation source, and the set size is called term_size. The green circle denotes all the input genes, e.g., the genes overlapped with any DMRs detected from a group comparison (genes having no annotations are excluded), and the gene set size is called query_size. The overlap (blue part) between the two circles denotes the input genes that are also annotated to the term, and its set size is called intersection_size. The statistical test examines whether the fraction intersection_size/query_size is significantly greater than term_size/effective_domain_size.